From Raw Data to Report in One Click: Automating Excel with VBA
How a 500 lines and 23 columns spreadsheet data gets turned into a structured summary report automatically without touching a formula?

Fuji Jauhari
Automation Specialist
Tools

Most businesses have at least one report that gets built the same way every month. Someone exports a flat file from a system, opens it in Excel, and spends the next hour sorting, grouping, and formatting it into something presentable. Then next month, they do it again.
This post walks through exactly that problem, and shows how a simple VBA macro eliminates the repetition entirely. The example uses a dummy dataset, but the pattern applies to any industry running regular operational or financial reports.
The Raw Data
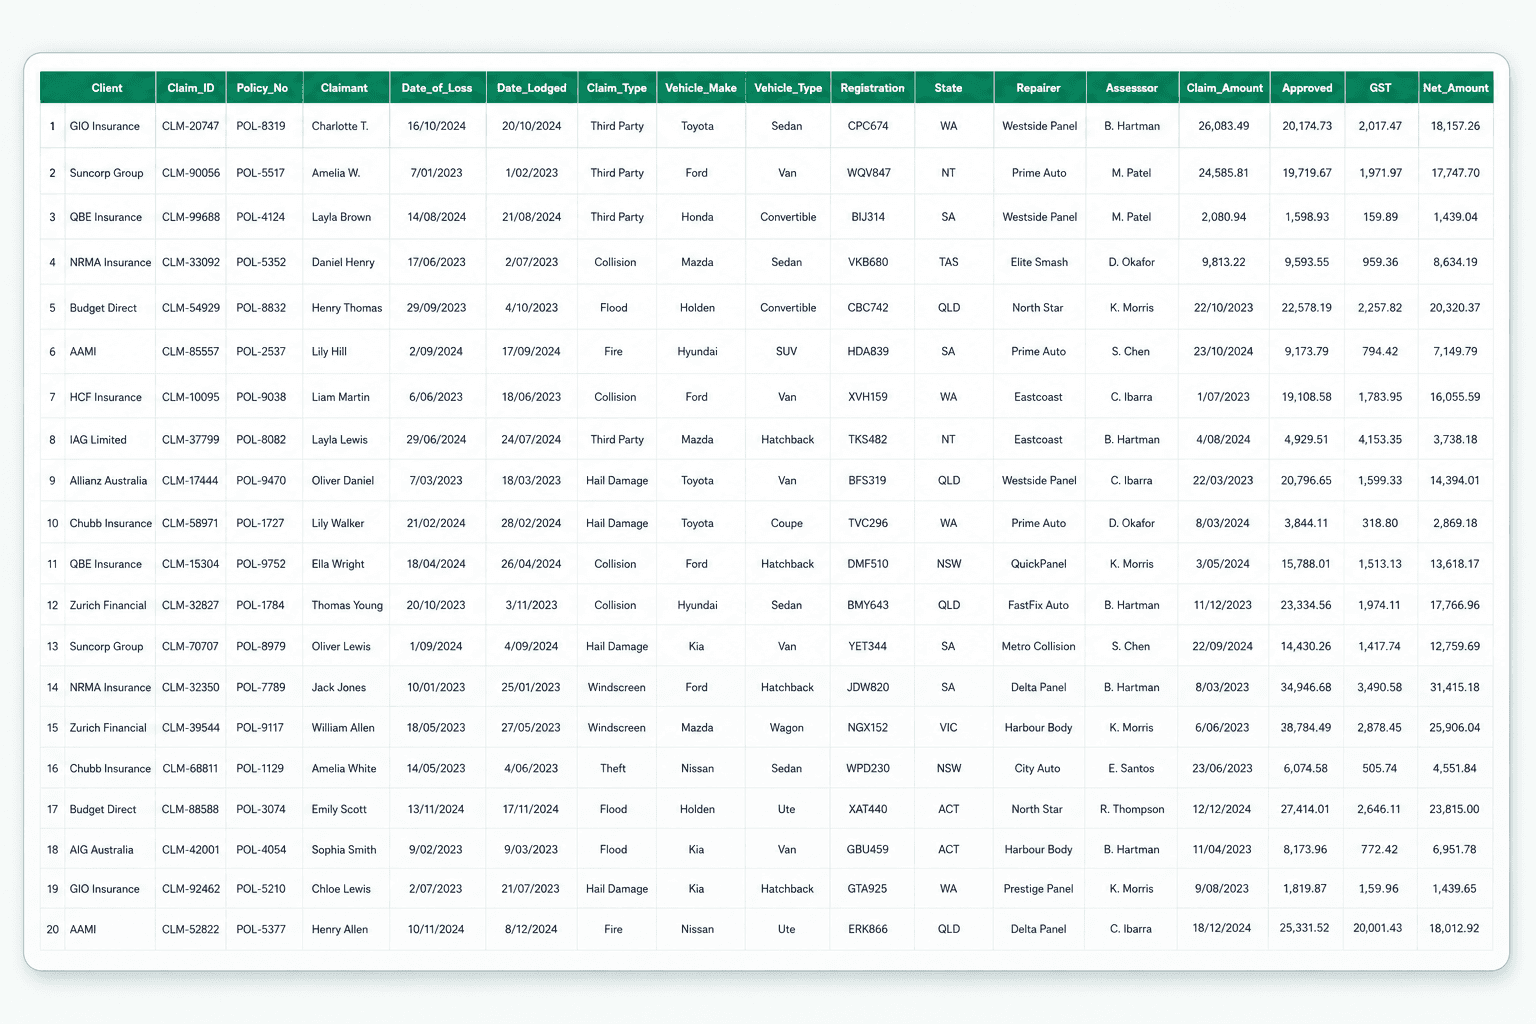
The starting point is 500 lines and 23 columns raw data. It covers fields you would find in any transactional export: a client name, reference numbers, dates, categories, dollar amounts, and a status column. Structured enough to work with, but not in a shape that is useful for reporting.
To get anything meaningful out of it, you would normally need to pivot it, group it, sum it, and format it every single cycle. The process is not difficult, just repetitive. And repetitive work in Excel is exactly what automation is for.
What the Macro Does
The VBA macro reads the entire dataset in one pass and produces a formatted Report sheet with five sections:
An Executive Summary with eight key metrics at a glance: total records, total value, approved value, approval rate, open versus closed counts, and unique client count.
Four breakdown tables: by client (sorted descending by total value), by category, by region, and by status. Each with counts, totals, averages, and alternating row shading applied automatically.
Everything is formatted on the way out. Section headers, dollar and percentage formatting, a totals row per table, column widths adjusted. The output lands on a dedicated sheet, cleanly separated from the source data.
What would take 60 to 90 minutes of manual work in Excel takes about three seconds.
Before and After
Before - raw data:
After - report result:
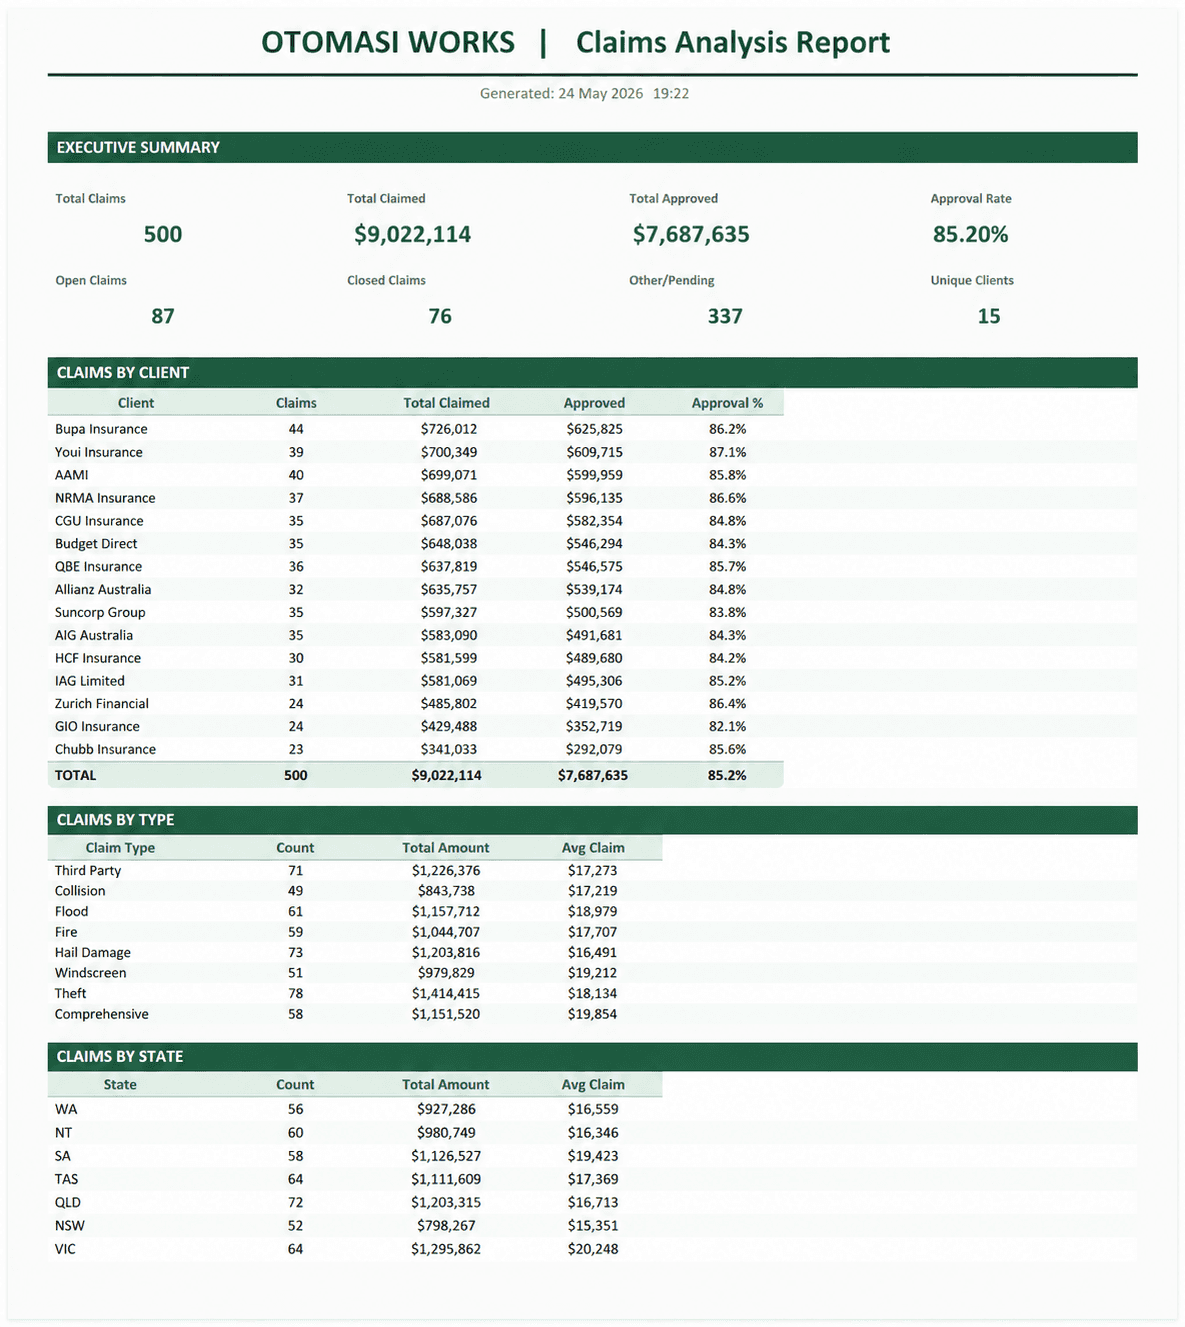
The before image shows the raw export: 500 lines of data, unformatted. The after image shows the completed report, a clean, structured document ready to share with a manager or client.
How it is Structured
The tool ships as three files. Download all three from the download button below and save them to the same folder on your computer before starting.
OtomasiReportMacro.bas: the VBA module containing all the visual basic for application code
Otomasi_Claims_Guide.xlsx: the workbook you will work from, with the Report sheet pre-built
otomasi_raw_claims_data.csv: the sample dataset to test with
Setup takes about two minutes and only needs to be done once.
Step 1 Open the guide workbook
Open Otomasi_Claims_Guide.xlsx in Excel. You do not need to enable macros yet. There are none in the file at this stage.
Step 2 Open the VBA Editor
Press Alt + F11 on Windows, or Option + F11 on Mac. This opens the Visual Basic Editor. You will see a project panel on the left showing the workbook.
Step 3 Import the module
In the VBA Editor menu, click File → Import File, navigate to where you saved OtomasiReportMacro.bas, and click Open. You should see OtomasiReport appear in the project panel under Modules.
Step 4 Save as a macro-enabled workbook
Close the VBA Editor and return to Excel. Press Ctrl + S to save. Excel will prompt you to save as a macro-enabled format. Click Yes and save the file as .xlsm. This step is important: if you save as .xlsx, the macro will not be kept.
Step 5 Run the one-time setup
Press Alt + F8 to open the macro menu. Select SetupWorkbook from the list and click Run. This adds a Generate Report button directly onto the Instructions sheet. You will see a confirmation message when it completes. This step only needs to be done once per workbook.
Step 6 Enable macros on next open
The next time you open the .xlsm file, Excel will show a yellow security bar at the top asking about macros. Click Enable Content. The workbook is now fully ready.
From this point on, the only step is clicking Generate Report button, selecting your data file when prompted, and switching to the Report tab to see the output.
Why This Matters
This kind of tool sits in a practical middle ground: too simple to justify a full BI platform, but too repetitive to keep doing by hand. Any team running regular reporting cycles finance, operations, customer service will have at least one workflow that fits this description.
VBA runs inside Excel, requires no additional software or licences, and can be handed to someone with no coding background. That combination makes it the right tool for small teams that need automation without infrastructure.
Download the Files
All three files are free to download and use:
OtomasiReportMacro.bas
Otomasi_Claims_Guide.xlsx
otomasi_raw_claims_data.csv